
 VOLUME INDEX:
The Volume Index decreased 1.8 points to 65.9 seasonally adjusted (SA) in June, down from a cycle high of 67.7 in May. June’s result was in the top quintile of our nearly 17-year survey, and as emphasized by the sharp decline in the Driver Availability Index, this has so far been largely a supply-driven recovery. Industrial demand has improved with data center investment, and while consumer demand remains soft, falling energy prices and fewer tariffs should support some inventory restocking in the coming months.
For-hire volumes should continue to benefit from growing capacity constraints even in a broadly soft demand environment. Vocational and flatbed markets are among the strongest areas for demand.
 FREIGHT RATES INDEX:
The Freight Rate Index decreased 9.5 points m/m to 70.2 in June (SA), from 79.7 in May. While off last month’s record high, June’s reading still ranks amongst one of the strongest in the survey’s history. Market balance has swung decisively in favor of fleets this year, and capacity broadly continues to tighten with Class 8 sales below replacement and enforcement of new driver regulations ongoing. These factors have added extraordinary momentum to the rate cycle and will not be corrected soon. Especially for shippers trying to grow, capacity is a major challenge this year. Tight market dynamics are likely to continue to drive rates higher.
CAPACITY INDEX: 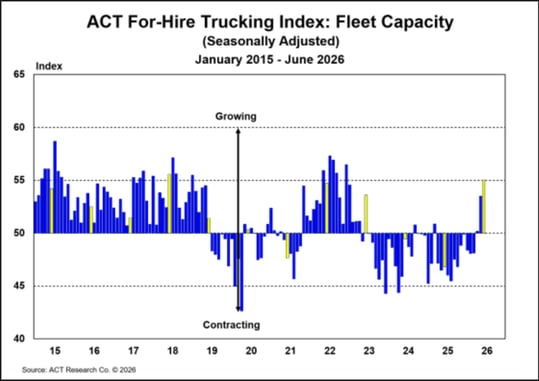
The Capacity Index increased 1.5 points m/m, to 55.0 (SA) in June from 53.5 in May, a 43-month high. While capacity at large is declining—Class 8 tractor sales remain below replacement—the pendulum swing back to for-hire carriers and the rapid acceleration of freight rate improvement the past three months is sending the expansion signal to carriers, especially among larger, well-run fleets like our survey respondents. Capacity expansion should pick up further in Q3/Q4 as spot rate gains flow through to contract rates, and carriers sate pent-up demand to replace aging equipment with one eye on EPA’27.
 DRIVER AVAILABILITY INDEX:
The driver shortage continued in June, as our Driver Availability Index ticked up to 34.1 in June, from 32.6 in May. The sharp drop since January follows a range of new FMCSA regulations including nondomiciled CDLs, reducing ELD and registration fraud, and closing driver schools. The new nondomiciled driver rules took effect in mid-March, and the Driver Availability Index hit a five-year low of 30.4 in April. After an initial purge of nondomiciled CDLs, the upticks in May and June, while modest, suggest near-term stabilization. Additional scarcity seems likely, supporting higher freight rates.
FLEET PURCHASE INTENTIONS INDEX: 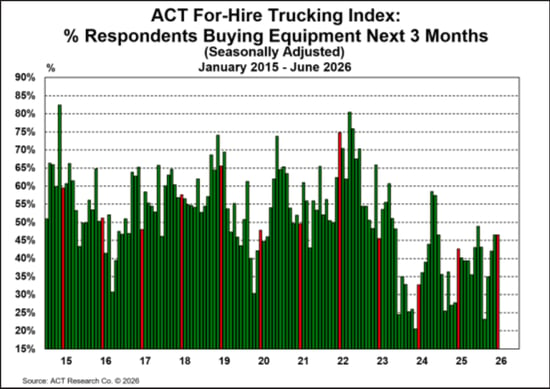
Fleet purchasing intentions stayed level m/m with 47% of fleets saying they plan to buy equipment in the next three months, but remained below June’s historical average of 53% of respondents planning on buying equipment. With spot rates rising at an extraordinary pace, equipment purchase intentions are soon likely to swing from tepid levels to elevated levels as fleets’ ability to invest will be supported by rising profitability levels. Factors dragging down buying intentions during the first half of the year are two-fold:
1) Entering 2026, for-hire carriers profit margins were at levels not seen since the Great Recession, drastically reducing capital spending.
2) While spot and contract rates have risen meaningfully, it takes roughly six months for spot gains to reach contract rates, at roughly half the rate, meaning large carriers in Q1 saw limited improvement. Margin improvement will expand from here.
 SUPPLY-DEMAND BALANCE INDEX:
Supply and demand rebalanced somewhat in June, with the index dropping to 60.9 (SA), down from 64.2 (SA) in May, as volumes slowed a little and fleets began to respond to higher rates with more capacity. Freight demand has improved materially for the quality fleets in the survey this year, as capacity has been pinched and data center investment accelerates. Despite a sluggish goods economy, the capacity correction is creating for-hire trucking demand, and a retail inventory restock has likely begun. Capacity is responding positively among our survey participants. While enforcement of new regulations continues, driver availability ticked up, as record driver pay packages are announced.
PRODUCTIVITY INDEX: 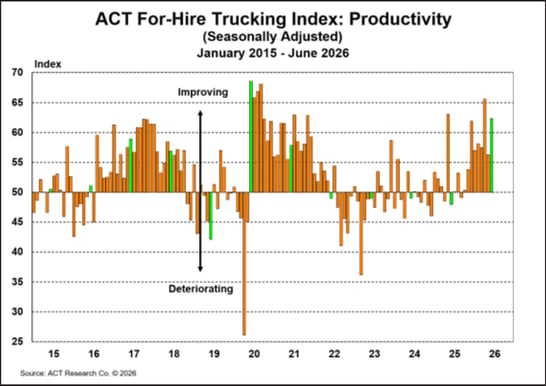
(miles/tractor)
Fleet productivity increased 6.0 points m/m, to 62.3 (SA) in June from 56.3 in May. The increase in productivity in June follows a correction following May’s Roadcheck-impacted decline. With strong volumes and expanding capacity, the elevated productivity reading suggests fleets are making good progress keeping their tractors seated, likely through driver pay increases.